How did today’s session go? How do the sessions in your circle go in general? Did they become valuable when you implemented a change?
You can easily gather and analyze the data for these questions, using the survey feature. Here is what you need to know:
STEP 1: Use the surveys in your session
STEP 2: Analyse your data
MORE INFO:
- The participant survey
- The facilitator survey
STEP 1: Use the surveys in your session
To make it easy for you and your peers to access the survey, it is a built in feature of the Circles technology.
- When creating your agenda, or when editing the agenda in the CirclesSpace™️, you can prepare a ‘Group Survey’ button in your agenda. But you can also open it on the go via the Tools menu.
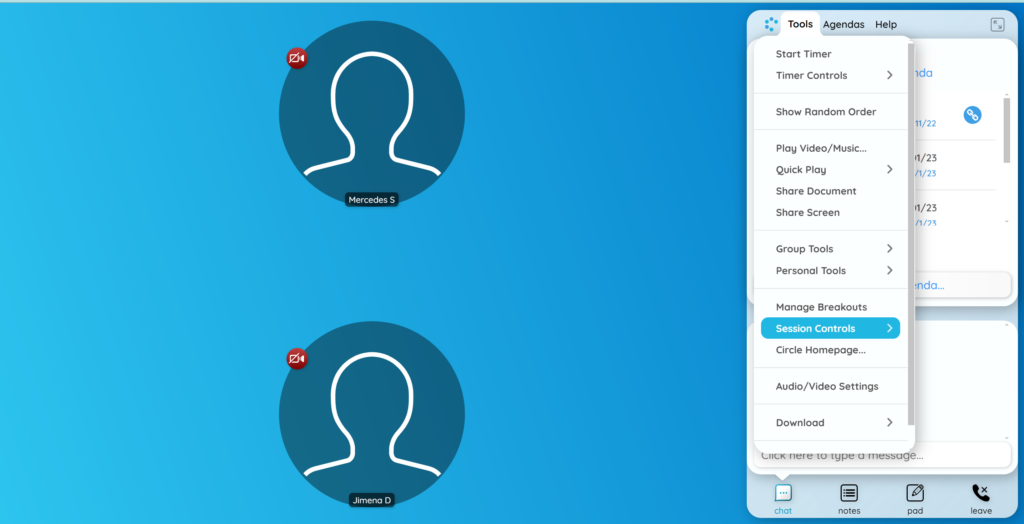
- Trigger the survey by clicking the button in your agenda, or selecting ‘Group Survey’ inside the Tools Menu under “Session Controls”

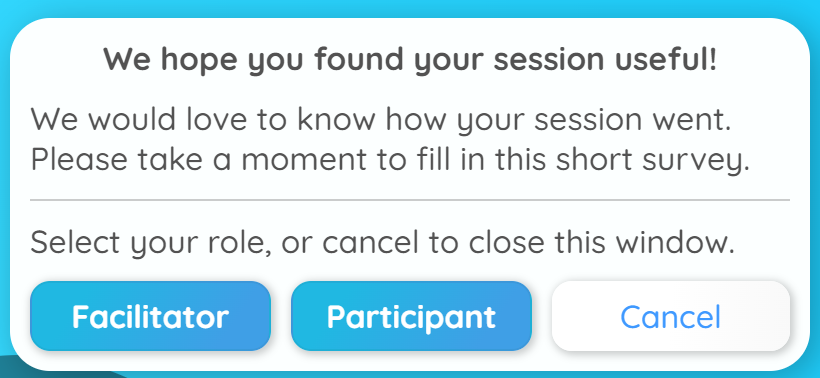
- A pop-up window will open in your CircleSpace™️. Each circle member will be able to individually select whether they facilitated today’s session or participated in it.
Matching their selection, each circle member will subsequently be shown be shown the facilitator survey or the participant survey.
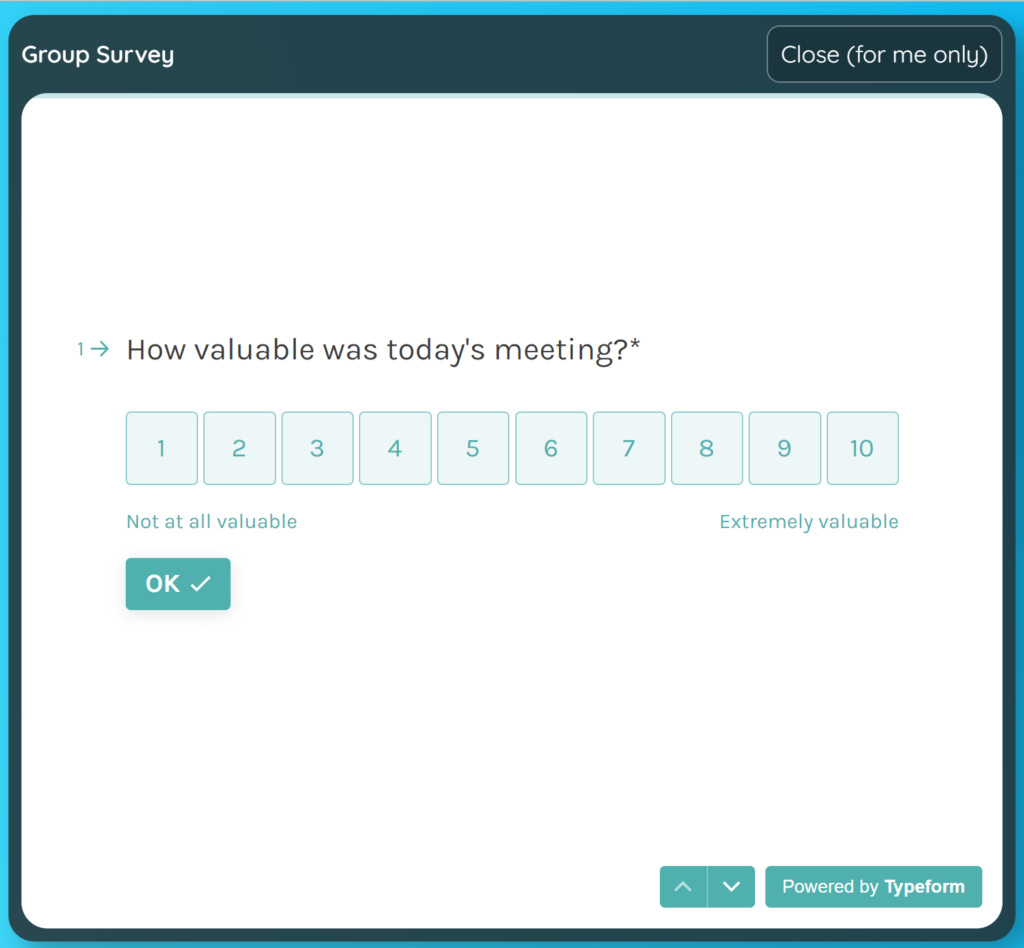
Clicking the x on the top right of the survey window will only close the survey for the person who clicked it. This way, each person can take as much time as they need to complete the survey.
STEP 2: Analyze your data
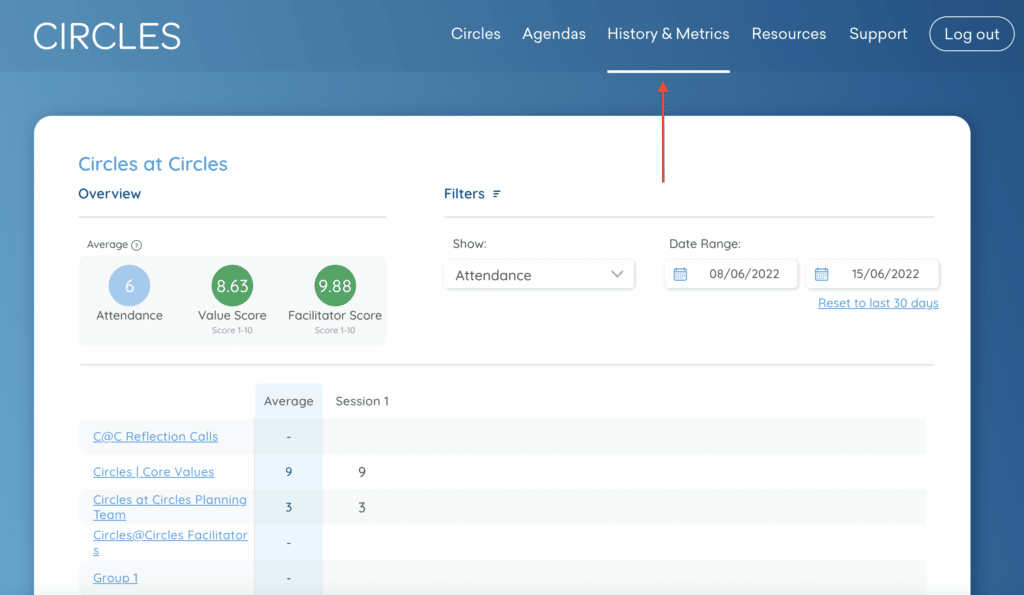
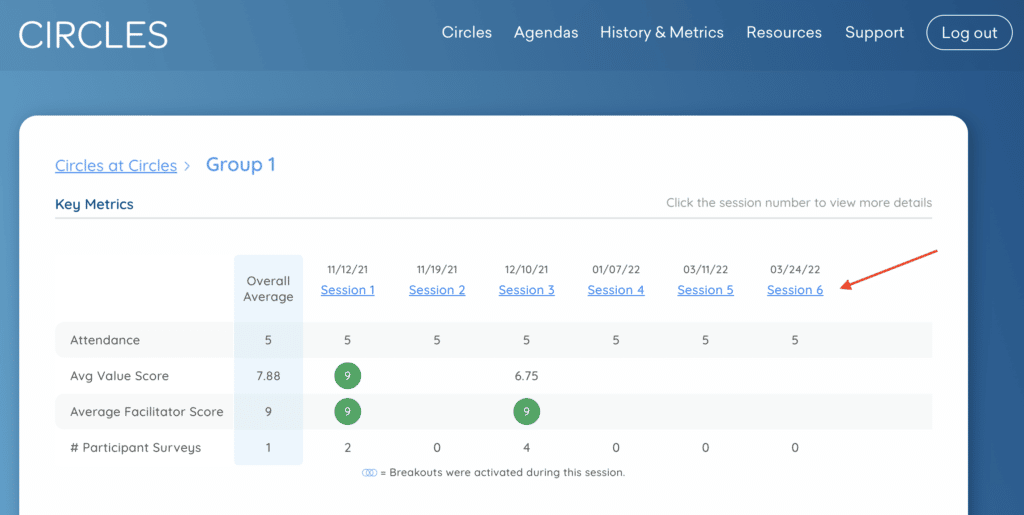
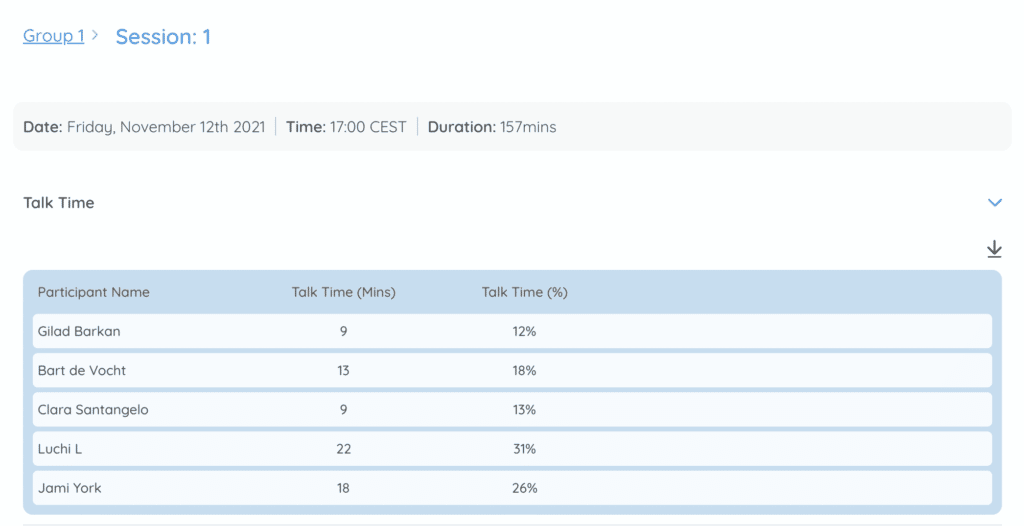
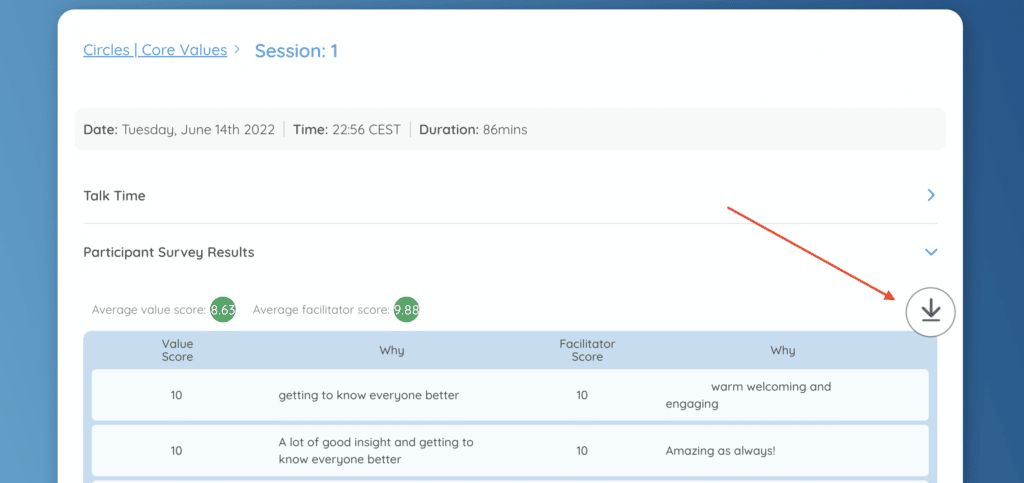
Go to your My.Circles Dashboard to consult your data. In the History & Metrics section, you can find the numerical scores, averages and evolution over time and selecting an individual circle and session, you can read the feedback each participant left.
MORE INFO
- The participant survey consists of 6 easy but useful questions:
- How valuable was today’s meeting?
1 = not at all valuable, 10 = extremely valuable - Why?
- Please assess your facilitator on how well they facilitated today’s meeting:
1 = very poor, 10 = excellent - Why?
- Did you experience any technical issues during the session?
- What did you have problems with?
- How valuable was today’s meeting?
- The facilitator survey goes beyond to work as a tool for more analysis and allow for easy communication with Circles:
- Rate your performance as a facilitator during today’s session
1 = very poor, 10 = excellent - Why?
- How valuable was today’s meeting?
1 = not at all valuable, 10 = extremely valuable - Why?
- What was most valuable for the circle?
- What needs improvement?
*(Agenda, structure, technology, training, or other) - Technology status: How was the video platform experience?
1 = Major issues, meeting had little to no value as a result
2 = Many higher priority issues, meeting was severely affected
3 = Several low to medium level issues, was distracting the meeting
4 = Some minor issues, did not greatly affect the meeting experience
5 = No issues. Everything worked great! - Any tech issues you would like to highlight?
- If applicable, who is the next Facilitator?
- Rate your performance as a facilitator during today’s session
